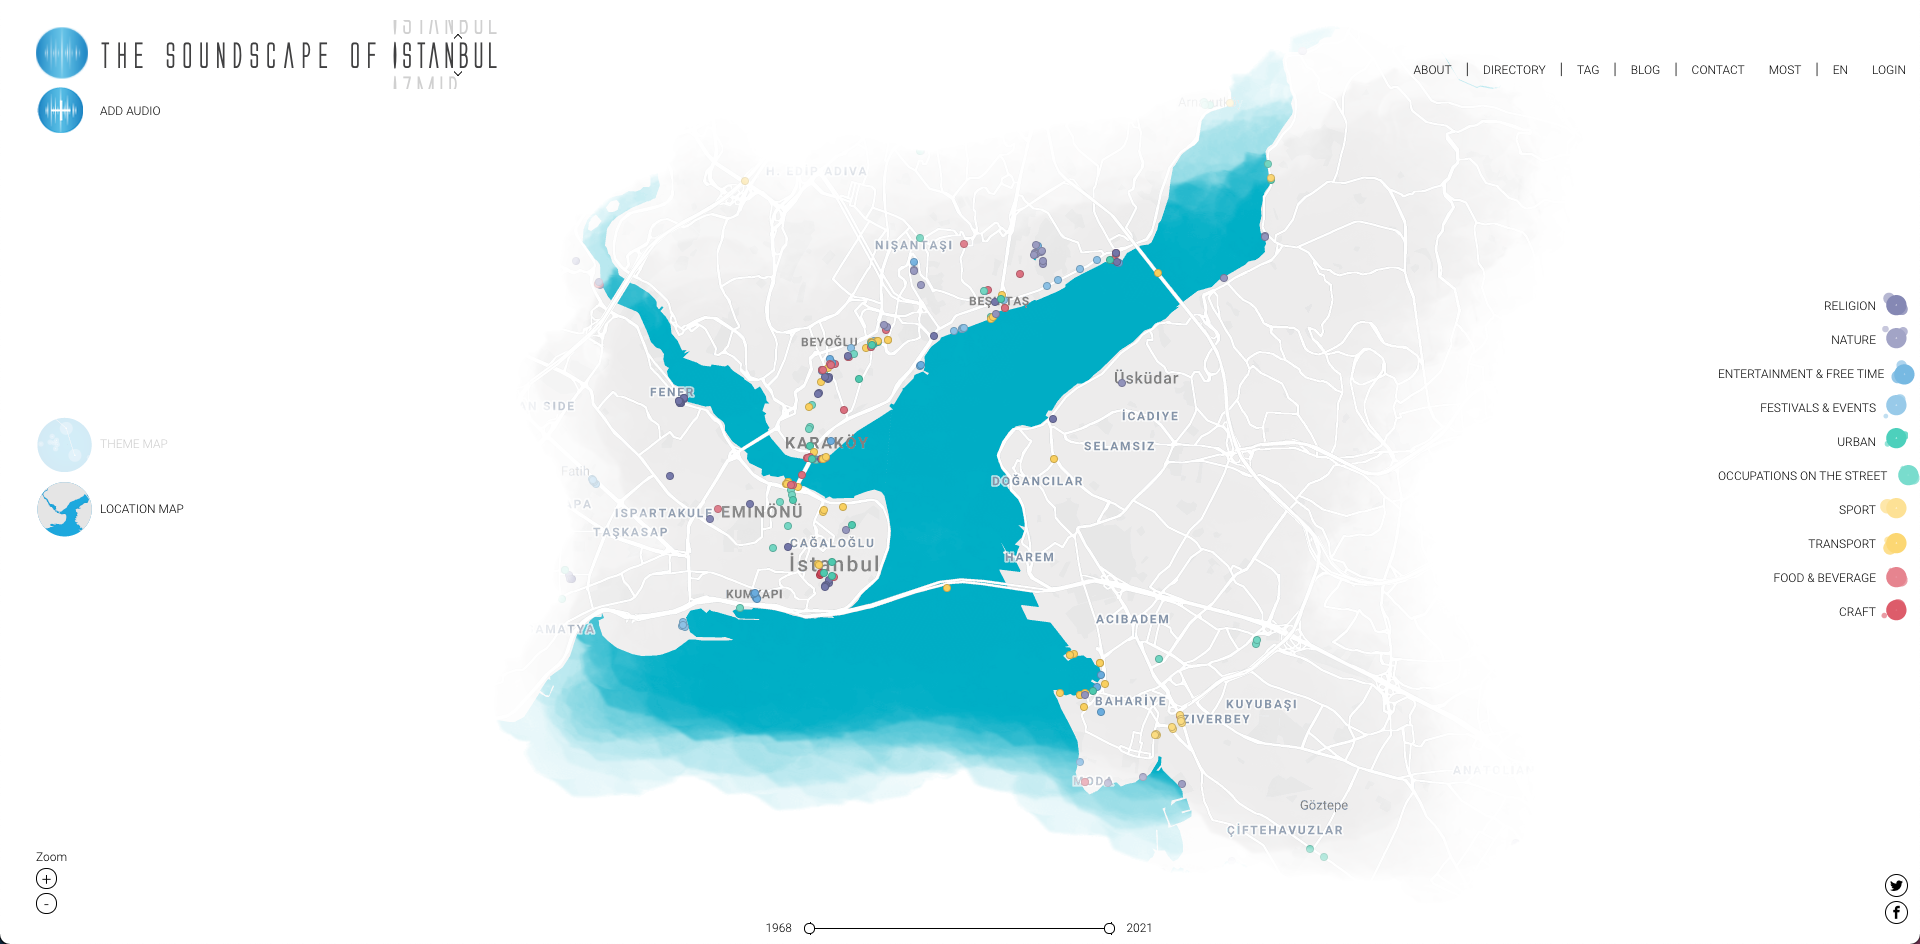
Explore the soundscape
Take a spin around the project! It’s completely interactive with audio intact.
The challenge
As a second-year student at IIT Guwahati, we had our first-semester thesis project for four months. I worked under Dr Abhishek Shrivastava to represent the various dialects, demographics, and recordings of the Assamese language in a suitable medium.
The project was based on an ongoing research project at the time, under Dr Priyankoo Sarmah, which studied the effects of socio-linguistic factors on vowel pattern variation across different dialects of Assamese.
TLDR, to create a soundscape interface derived from the data from a research project for anyone to access and interpret.
Research
The research report
The original report from the research is now published and available over at ResearchGate.
I spent around a couple of weeks going through this report multiple times, understanding phonetics and how linguistics works. There were a few things that could be easily represented for the end-user, including:
Audio recordings

Dialect mapping
Level of pride data

Lexical variations

Soundscapes
A term first coined by the Canadian composer R. Murray Schafer, a soundscape is a sonic landscape. It is the total acoustic values related to a specific place. Soundscapes can be understood only through peoples’ perceptions. Information can easily be interpreted when we create an abstraction with the sounds from the soundscape. Data is inherently difficult for the human brain to understand and retain. Most adults can store between 5 and 9 items in their short-term memory.
I also spent time on the basics of data visualisation, because at the core, a soundscape is an auditory depiction of data.
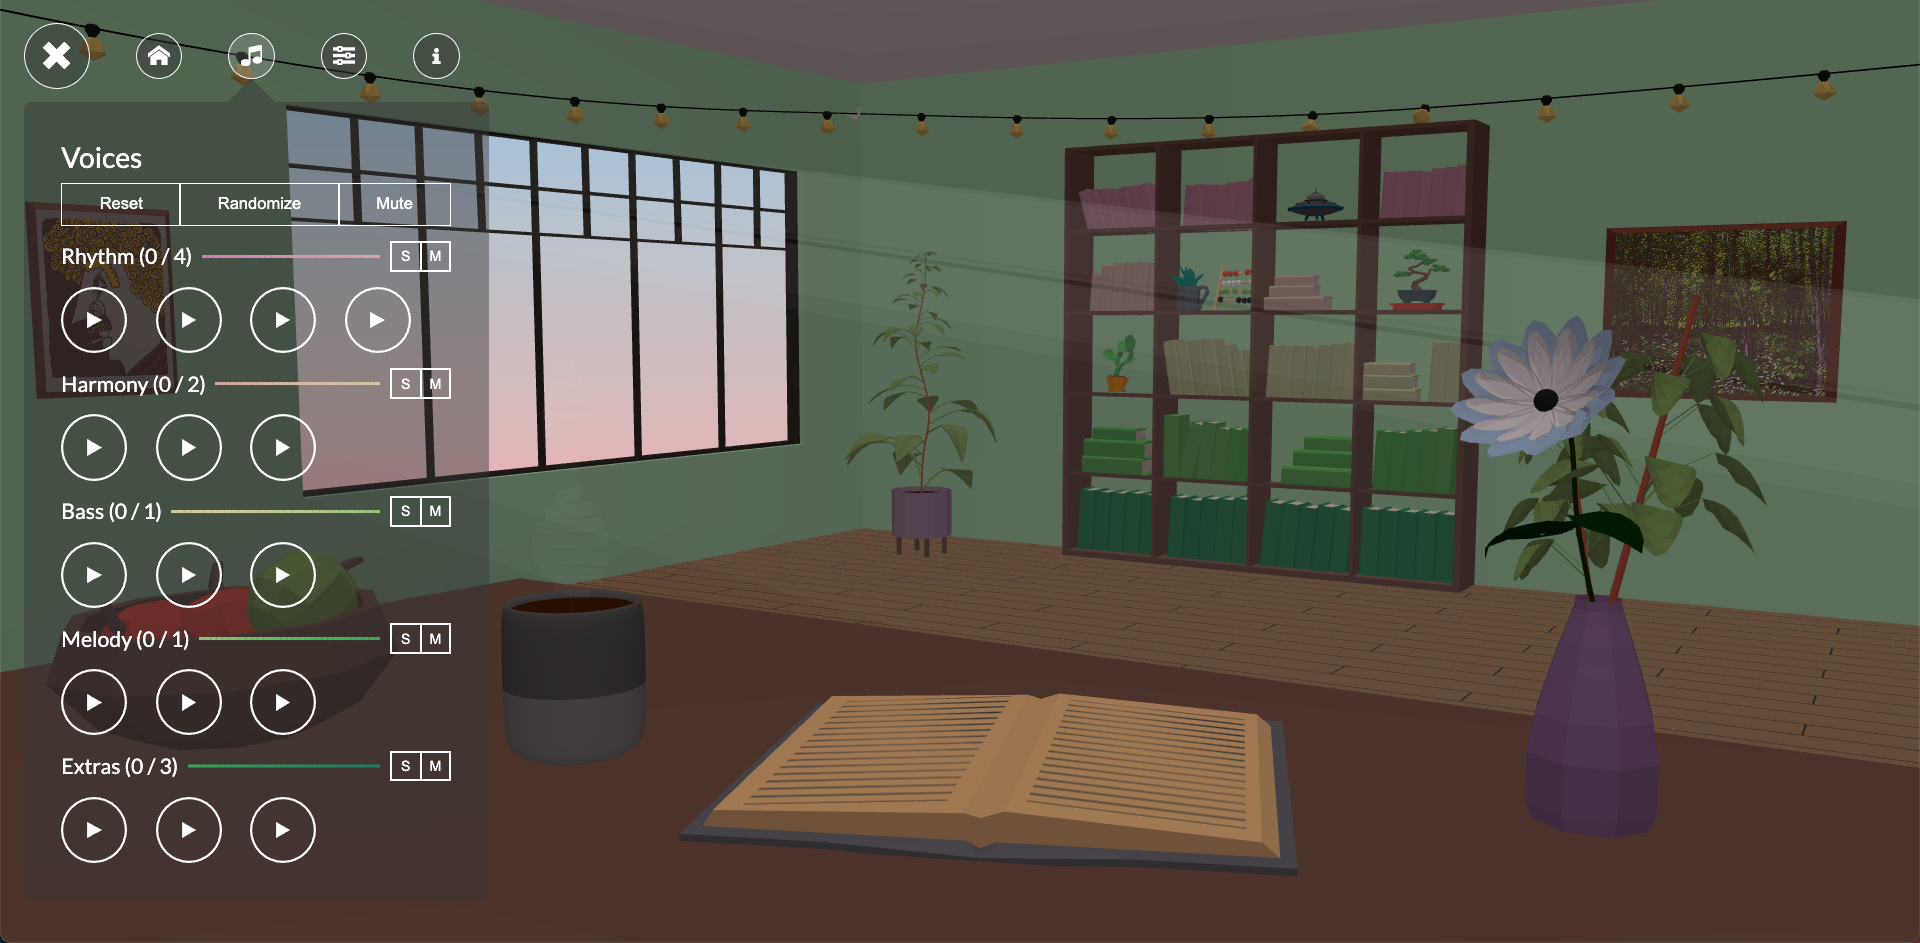
Existing designs
I came across 2 soundscapes which had good interactions and depicted auditory information in a creative design.
The concept
I decided to divide the design into three sections. These had different colours, indicating the data is different from one another. I started with some concept sketches.
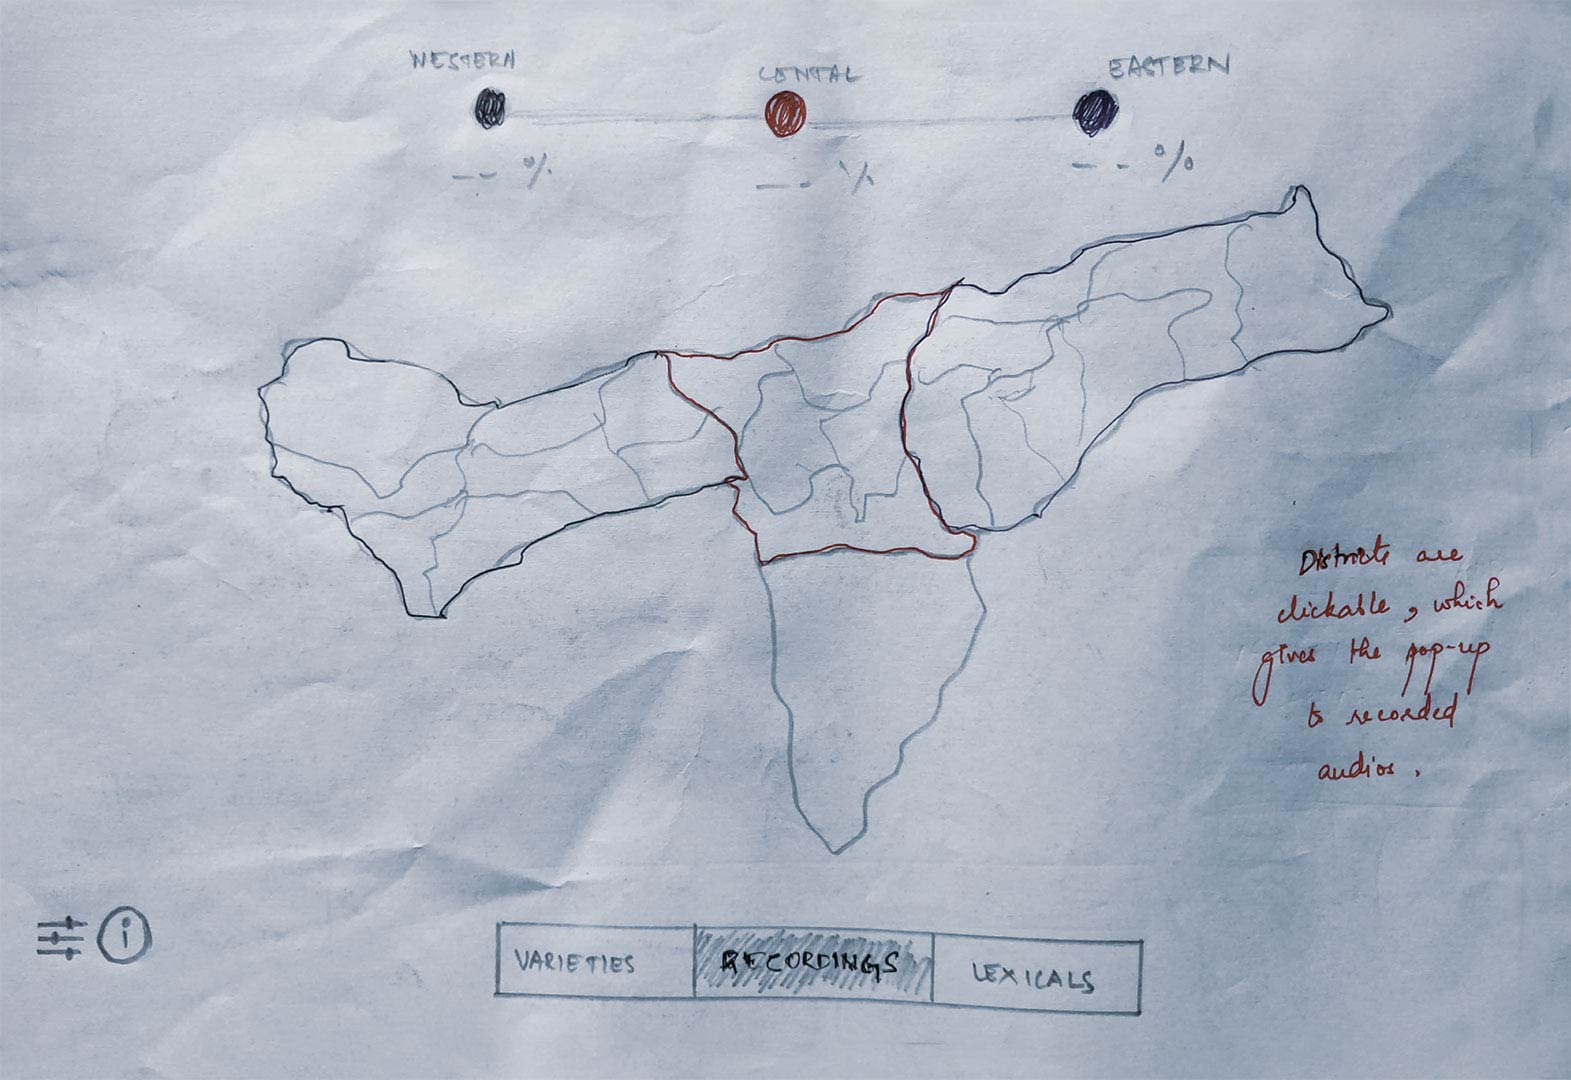
Dialects tab
The user can listen to speech recordings from various districts of Assam. These, when clicked, show a pop-up with multiple play buttons placed accurately.
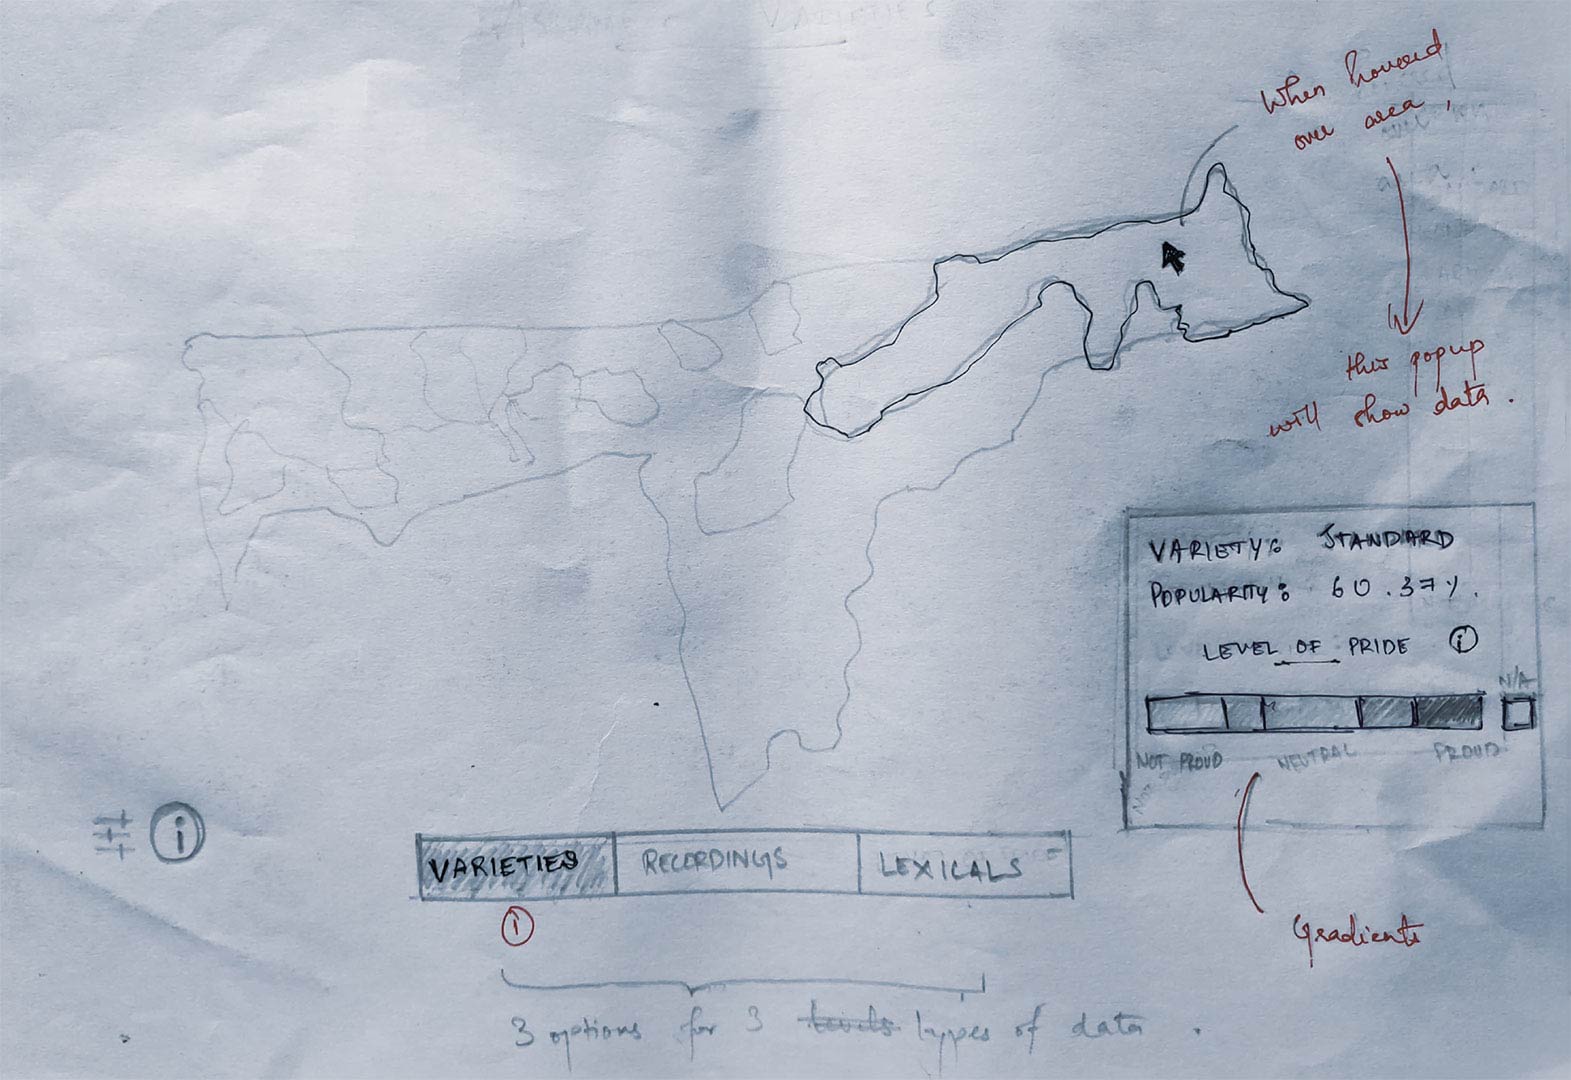
Listen tab
Shows the different dialects across the state. One can hover over a region to see what variety they speak, their popularity and how proud they are of their language.
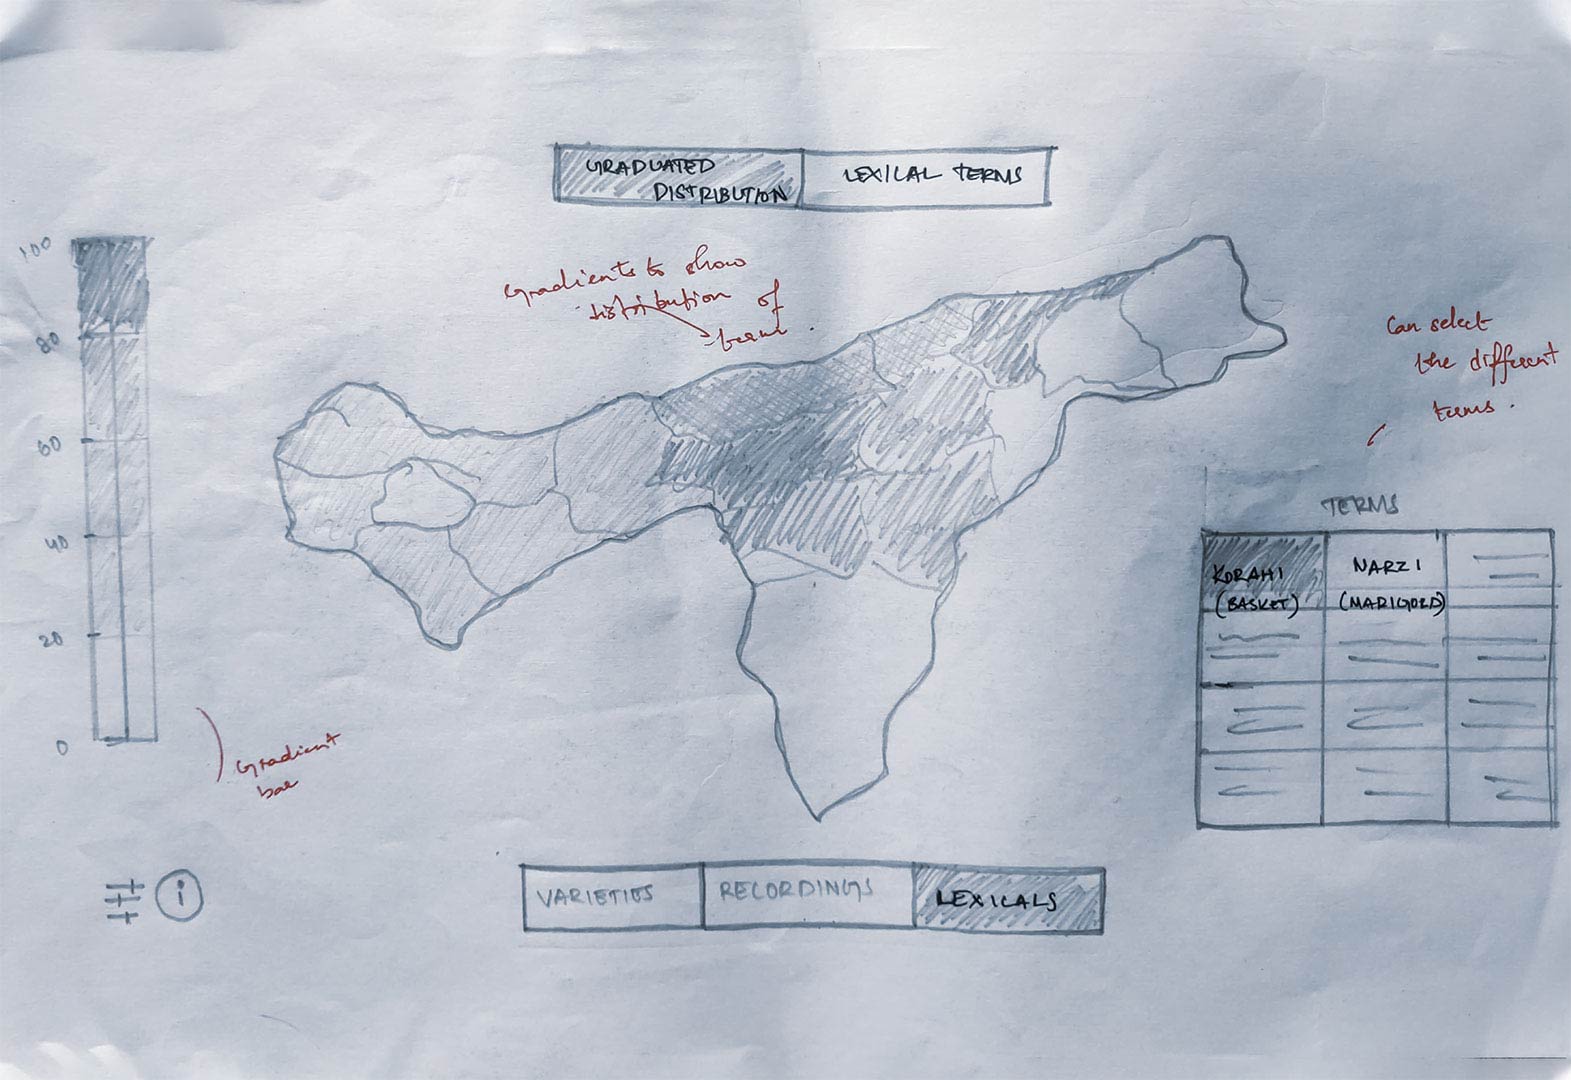
Words tab
Shows the distribution of lexical terms. Twelve terms were selected, which had multiple synonyms to study the usage of these words in different regions. We put these terms in a grid, and we showed the distribution using a gradient. The darker the shade, the more frequent the word was used in that region.
Final designs
The platform was developed using HTML5, with Bootstrap 4 as the front-end framework for CSS. JavaScript, accompanied by the jQuery library, was used to handle the back-end of the website. It is currently hosted on GitHub pages.


Reflections
This project was a game-changer for me. I had always wanted to start with WebD, and this project was enough motivation to get started with. I have come a long way since then, creating my website entirely from scratch.
Coming to the project, there were a few shortcomings that I could have done better.
- Call to Action functions for the user is limited, and thus, interactions with the user are minimal.
- Currently, there are no ways to upload audio by the user. This means our project data cannot be crowd-sourced.
- The recordings are short and repetitive and hence doesn’t capture the user’s attention for long.
If given the time and energy, a function to record the user’s speech can be implemented. This would enhance user intractability and would also serve to crowd-sourced data. Moreover, this speech can be used to compare with other audio to determine their variety.