The challenge
Nutanix provides a leading next-generation enterprise cloud platform that converges traditional silos of server, virtualisation and storage into one integrated solution that connects to public cloud services.
During my two months over there, I worked on their flagship product, Prism, an end-to-end management solution for IT administrators to centrally manage their entire hardware stack, including storage, compute and virtual machines (VMs), all from a single tab. Prism has a tool, xAnalyze, which is used to ease the day-to-day operations of a system administrator. This tool is also used to pinpoint if any system is running rogue and move faster to the root cause of the issue.
TLDR, to elevate the role of an admin and help them monitor their systems and help them troubleshoot faster and easier.
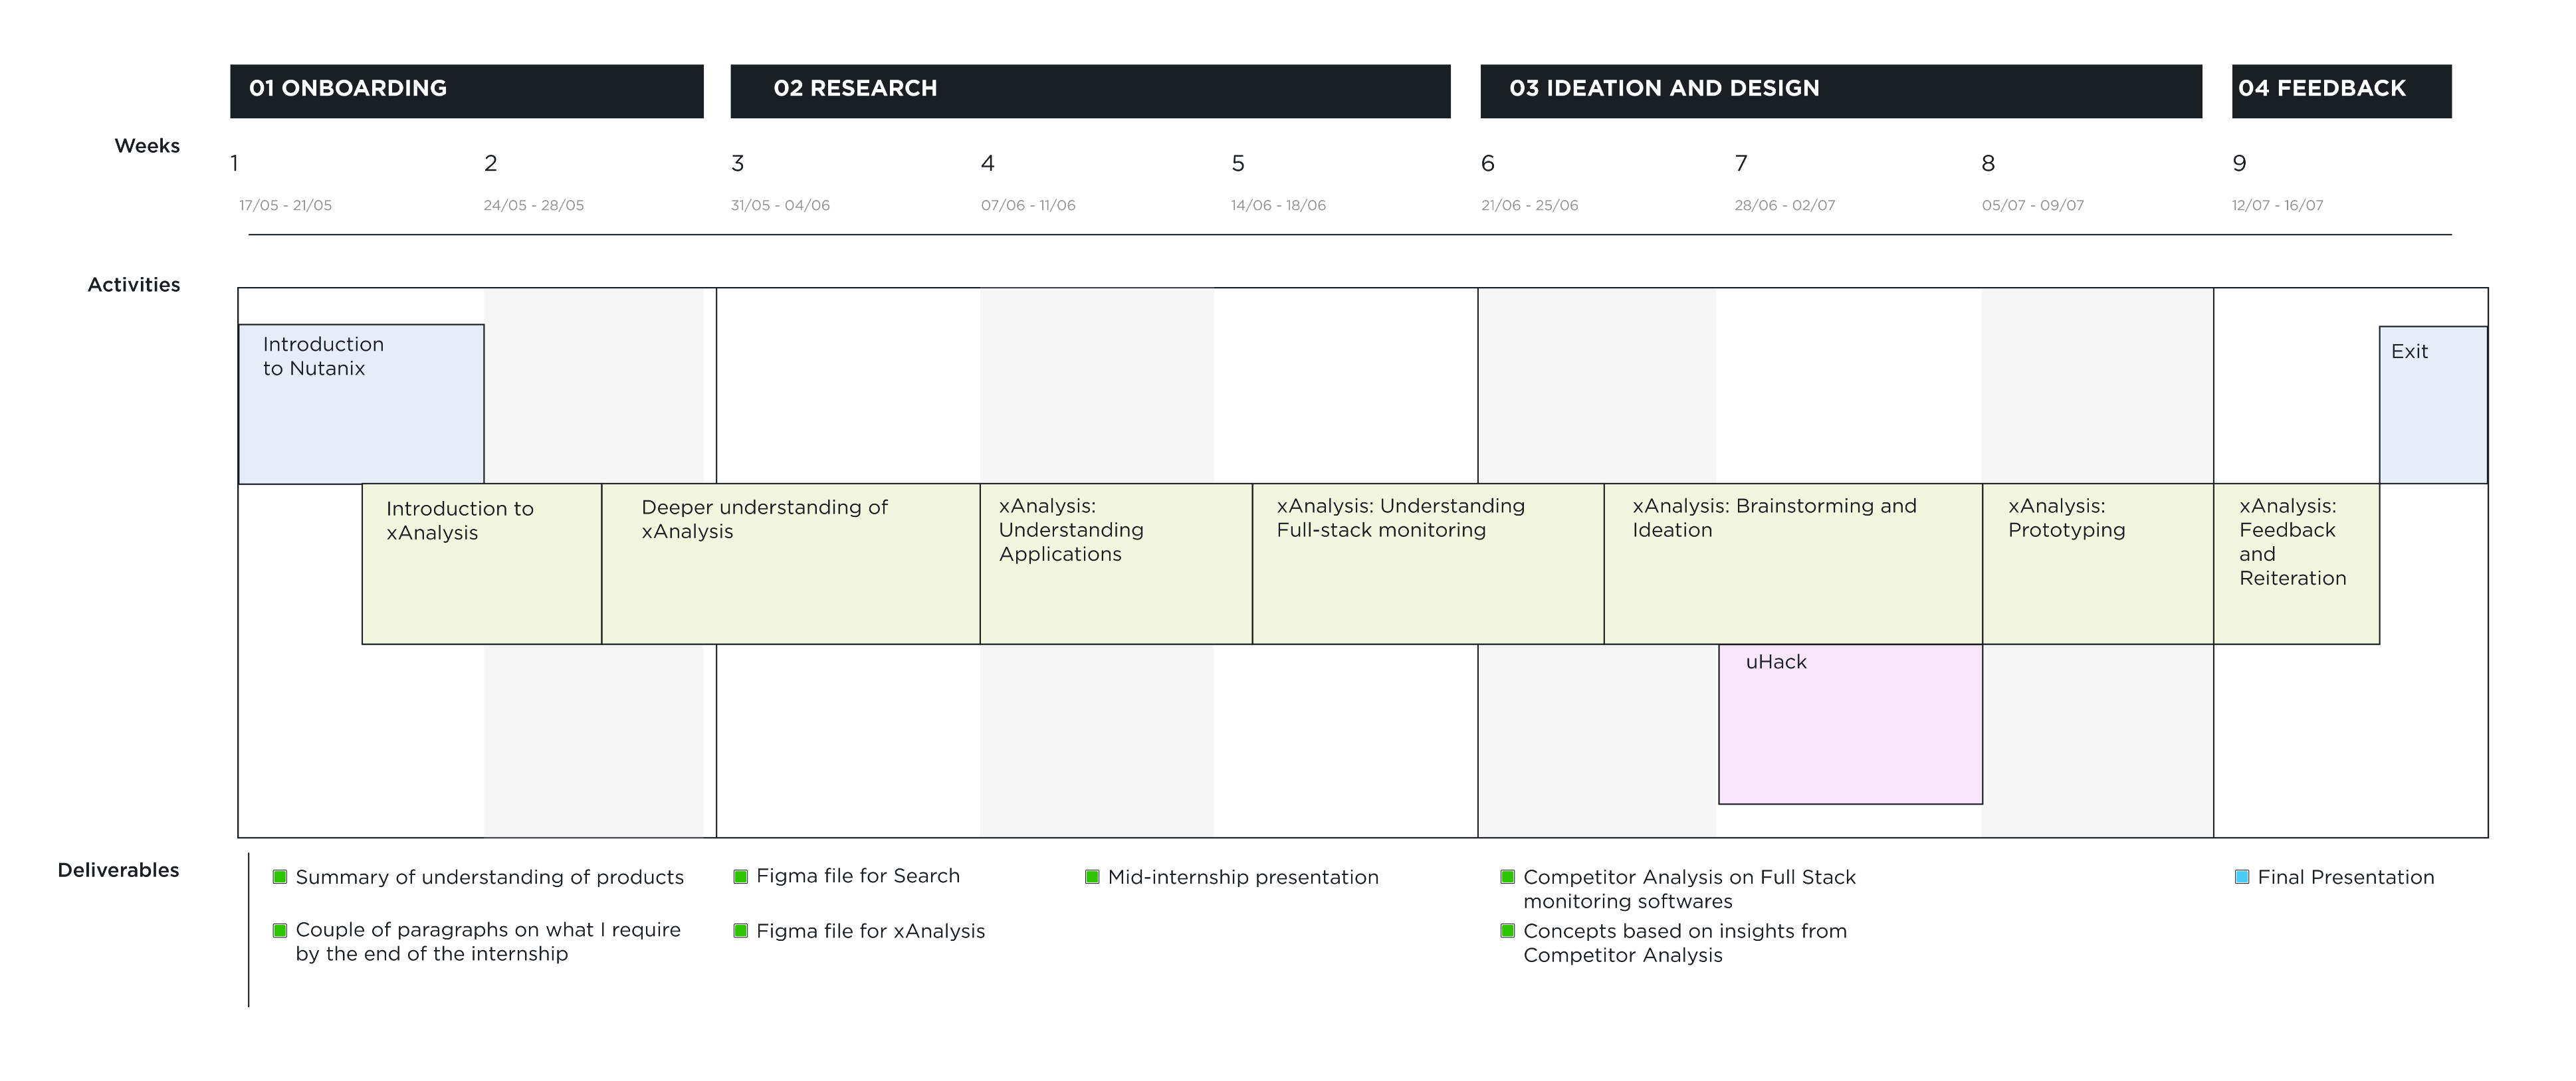
Timeline
xAnalysis
xAnalysis is a tool under Prism used to ease the day to day operations of a system administration. The tool gives useful information to the user to understand how the entities are functioning. It provides a way to pinpoint if any system is running rogue or hogging up resources, by providing information to move faster to the root cause of the issue.
Intent
To understand how the Analysis section is used by the sysadmins. Research on how the users utilise the various features in it to pinpoint to the problem. To understand if there is any delay in getting the user to the cause and if there is any room for improvement. To identify if there’s any new feature which can be implemented within the section which will cater to the user and improve the whole experience. Work on prototypes and implement these new changes.
Current experience
See an warning or a critical alert on the dashboard. Navigate to the analysis page. Set the time period to scan for spikes in the charts (Memory, CPU, IOPS) See where the spikes occur. Set up a troubleshooting session with related charts and metrics. Try to rectify using known methods. Providing the node with additional resources via the Prism Panel. Add a new node to add more resources to the cluster. Identify any rogue applications and rectify it.
Avenues to focus
Application Metrics In the current version of Prism, we can view the metrics only up to the level of VMs. Adding metrics on an appplication level would give sysadmins more information on why their systems are hogging up. Adding a chart with comparisons with other entities would help identifications of affected clusters. Would open a business angle as we can collaborate with third party application developers. Visual Representation of VM Contention Finding relationships between different entities. Would aid in ease of diagnosis. Topology view Predictive Warnings Warning users about potential effects in the near future when any issue occurs Can use the timeline to inform the user Help admins easily predict certain issues
My learnings
-
This was my first time working with an enterprise company, and the opportunity to spearhead my project from start to finish was refreshing.
-
I got to also co-create with other designers, and the developers from the team had a design-friendly approach. Coupled with handling the industry deadlines and working with people from different time zones, the internship proved to be an invaluable learning experience.
-
Every day, technology becomes a more integral part of our lives, and we have reached that point where you can monitor your blood oxygen levels from your wristwatches. This whole space is underused, and there’s much growth potential.
The team